PHP/PHP
PHP - Docker Prometheus Grafana 모니터링
- -

개요
php로 서비스를 운영하며 속도가 너무 느려 원인을 찾아보려 했으나 코드상에서 병목이 발생할만한 부분을 찾지 못했다.
서버 성능의 문제가 아닌가 싶었지만 원인을 분명히 하고 싶어 모니터링 시스템을 추가하게 되었고 많은 모니터링 시스템 중 Prometheus Grafana 조합을 선택하게 되었다.
왜 Prometheus + Grafana인가?
| 기준 | Prometheus + Grafana | Zabbix | Nagios | InfluxDB + Chronograf | Datadog |
|---|---|---|---|---|---|
| 데이터 수집 | Pull 기반, PHP-FPM exporter로 PHP 메트릭 수집 가능, 다양한 exporter 지원 | Push 기반, 에이전트 설치 필요, PHP 스크립트로 커스텀 메트릭 지원 | 스크립트 기반 체크, PHP 메트릭은 플러그인으로 제한적 | Push 기반, Telegraf 플러그인으로 PHP 메트릭 수집 가능 | 에이전트 기반, PHP 통합 가능, 다양한 애플리케이션 메트릭 지원 |
| 시각화 | Grafana의 강력한 대시보드, 다양한 차트와 템플릿 지원, 커뮤니티 대시보드 풍부 | 기본 대시보드 제공, Grafana 통합 가능하나 설정 복잡 | 기본 UI 제한적, 외부 도구(Grafana 등) 필요 | Chronograf 제공, Grafana보다 시각화 옵션 제한적 | 고급 대시보드, 사용자 친화적이나 비용 발생 |
| 쿼리 기능 | PromQL로 강력하고 유연한 쿼리, 복잡한 분석 가능 | SQL 기반 쿼리, 복잡한 쿼리는 제한적 | 쿼리 기능 제한적, 스크립트에 의존 | InfluxQL, PromQL보다 직관적이나 덜 유연함 | 자체 쿼리 언어, 유연하지만 학습 필요 |
| 확장성 | Prometheus는 고가용성 설정 복잡(Thanos 등 필요), Grafana는 다중 데이터 소스 지원 | 대규모 환경 지원, 클러스터링 가능 | 소규모/정적 환경에 적합, 대규모는 복잡 | 고가용성 및 장기 저장 지원, 설정 간단 | 클라우드 기반, 높은 확장성, 관리 용이 |
| 설정 용이성 | Docker로 배포 간단, PHP-FPM exporter 설정 쉬움, 초기 학습 필요 | 에이전트 설치 및 설정 복잡, UI 기반 설정 가능 | 플러그인 설치 및 구성 복잡, 수동 작업 많음 | Telegraf 설정 간단, UI 기반 관리 가능 | 에이전트 설치 간단, 클라우드 기반으로 설정 최소화 |
| PHP 통합 | PHP-FPM exporter로 PHP 메트릭 수집 용이, 커스텀 메트릭 지원 | PHP 스크립트로 커스텀 메트릭 가능, 설정 추가 필요 | PHP 모니터링은 플러그인 개발 필요, 제한적 | Telegraf로 PHP 메트릭 수집 가능, 추가 설정 필요 | PHP-FPM 및 애플리케이션 메트릭 지원, 통합 쉬움 |
| 커뮤니티 지원 | CNCF 졸업 프로젝트, 활발한 커뮤니티, 풍부한 문서 및 exporter | 오픈소스, 대규모 커뮤니티, 다양한 플러그인 | 오래된 오픈소스, 플러그인 생태계 제한적 | 오픈소스, Prometheus보다 커뮤니티 작음 | 상용 솔루션, 커뮤니티 제한, 공식 지원 강력 |
| 비용 | 오픈소스, 무료, 관리형(Grafana Cloud 등)은 유료 옵션 | 오픈소스, 무료, 엔터프라이즈 지원 유료 | 오픈소스, 무료, 상용 버전(Nagios XI) 유료 | 오픈소스, 무료, InfluxCloud는 유료 | 유료, 구독 기반, 무료 티어 제한적 |
간단하게 요약하자면
- Docker로 배포하기 쉽다.
- PHP 메트릭 수집이 간단하다.
- 추후 진행할 mysql 모니터링 시스템도 추가하기 간단하다.
- 기본적인 기능이 무료이고 오픈소스다.
- 커뮤니티가 활발하게 운영되고 있어 자료 수집이 원활하다.
크게 위 5가지 이유로 Prometheus + Grafana를 선택하게 되었다.그리고 Grafana 대시보드가 너무 예쁘다
디렉토리 구조
디렉토리 구조는 아래와 같다.
~
├── grafana
│    ├── prometheus.yml
│    ├── promtail-config.yml
│    └── docker-compose.yml
└── php
     └── logs
시스템 구조
모니터링 시스템 구조는 아래와 같다.
[Apache Logs] ------------> [Promtail] ----------> [Loki]
                                                      |
                                                      v
[Node Exporter] --------> [Prometheus] --------> [Grafana]
                                                      ^
                                                      |
[Apache server-status] --> [Apache Exporter] --> [Prometheus]

* 모든 서비스는 'local_net' 네트워크를 통해 연결
* 볼륨:
  - Prometheus: prometheus-data
  - Grafana: grafana-data
  - Loki: loki-data
Apache Logs: /var/log/apache2 디렉토리에서 생성된 로그를 Promtail이 읽음.
Promtail: 로그를 수집하여 Loki로 전송.
Loki: 로그를 저장하고 Grafana에서 시각화를 위해 사용
Node Exporter: 시스템 메트릭(CPU, 메모리 등)을 Prometheus로 제공
Apache Exporter: Apache 서버 상태(http://apache-server/server-status?auto)를 스크랩하여 Prometheus로 전송
Prometheus: 메트릭을 저장하고 Grafana로 데이터 제공
Grafana: Prometheus(메트릭)와 Loki(로그)를 소스로 사용하여 대시보드 제공
네트워크: 모든 서비스는 local_net 네트워크를 통해 통신
볼륨: 각 서비스의 데이터는 prometheus-data, grafana-data, loki-data에 저장
apache /server-status 설정
1. mod_status 모듈 활성화 확인
# status_module이 나타나면 활성화 되어있음
apachectl -M | grep status

# 나타나지 않으면 활성화
sudo a2enmod status
2. Apache 설정 파일 수정
# 설정 파일 열기
sudo vi /etc/apache2/conf-available/server-status.conf
<IfModule mod_status.c>
# 자세한 상태 정보를 표시
ExtendedStatus On
<Location /server-status>
# 핸들러 설정
SetHandler server-status
</Location>
</IfModule>3. Apache 재시작
sudo service apache2 restart4. 테스트
http://apache-server/server-status(본인의 아파치 서버 url)로 접속하여 페이지가 정상적으로 표시되는지 확인
모니터링 시스템 설정
1. grafana/prometheus.yml
# Prometheus 전역 설정
global:
  # 메트릭 수집 주기 설정 (15초마다 수집)
  scrape_interval: 15s

# 수집할 대상 설정
scrape_configs:
  # Node Exporter 설정 - 시스템 메트릭 수집
  - job_name: 'node'
    static_configs:
      - targets: ['grafana-node-exporter-1:9100']

  # Apache Exporter 설정 - Apache 웹서버 메트릭 수집
  - job_name: 'apache'
    static_configs:
      - targets: ['grafana-apache-exporter-1:9117']
2. grafana/promtail-config.yml
# Promtail 서버 설정
server:
  # HTTP 서버 포트 설정
  http_listen_port: 9080
  # gRPC 서버 비활성화
  grpc_listen_port: 0

# 로그 파일 위치 추적을 위한 설정
positions:
  filename: /tmp/positions.yaml

# Loki 서버 연결 설정
clients:
  - url: http://grafana-loki-1:3100/loki/api/v1/push

# 로그 수집 설정
scrape_configs:
  - job_name: system
    static_configs:
      # PHP 에러 로그 수집 설정
      - targets:
          - localhost
        labels:
          job: php-error
          __path__: /var/log/apache2/php_errors.log
      # PHP 액세스 로그 수집 설정
      - targets:
          - localhost
        labels:
          job: php-access
          __path__: /var/log/apache2/access.log
      # PHP 일반 로그 수집 설정
      - targets:
          - localhost
        labels:
          job: php-info
          __path__: /var/log/apache2/error.log
3. grafana/docker-compose.yml
# Docker Compose 버전 정의
version: '3.8'
services:
  # Prometheus: 메트릭 수집 및 저장을 위한 모니터링 시스템
  prometheus:
    image: prom/prometheus:v2.54.1
    volumes:
      - ./prometheus.yml:/etc/prometheus/prometheus.yml  # Prometheus 설정 파일
      - prometheus-data:/prometheus                      # 메트릭 데이터 저장소
    networks:
      - local_net

  # Grafana: 시각화 대시보드 도구
  grafana:
    image: grafana/grafana:11.2.0
    volumes:
      - grafana-data:/var/lib/grafana                   # Grafana 데이터 저장소
    ports:
      - "4000:3000"                                     # 외부 접속 포트:4000(기본적으로는 3000포트를 많이 사용하나, 보통 다른 서비스가 3000포트를 사용하는 경우가 많아 4000으로 설정), 내부 포트:3000
    networks:
      - local_net

  # Loki: 로그 수집 및 저장 시스템
  loki:
    image: grafana/loki:3.1.1
    volumes:
      - loki-data:/loki                                 # 로그 데이터 저장소
    networks:
      - local_net

  # Promtail: 로그 수집기
  promtail:
    image: grafana/promtail:3.1.1
    volumes:
      - ./promtail-config.yml:/etc/promtail/config.yml  # Promtail 설정 파일
      - ../php/logs:/var/log/apache2                 # Apache 로그 디렉토리
    networks:
      - local_net

  # Node Exporter: 시스템 메트릭 수집기
  node-exporter:
    image: prom/node-exporter:v1.8.2
    volumes:
      - /proc:/host/proc:ro                            # 프로세스 정보
      - /sys:/host/sys:ro                              # 시스템 정보
      - /:/rootfs:ro                                   # 루트 파일시스템
    command:
      - '--path.procfs=/host/proc'
      - '--path.sysfs=/host/sys'
      - '--path.rootfs=/rootfs'
    networks:
      - local_net

  # Apache Exporter: Apache 웹서버 메트릭 수집기
  apache-exporter:
    image: lusotycoon/apache-exporter:v1.0.9
    command:
      - --scrape_uri=http://apache-server/server-status?auto  # Apache 상태 페이지 URL
    networks:
      - local_net

# 영구 저장소 정의
volumes:
  prometheus-data:    # Prometheus 데이터 저장소
  grafana-data:       # Grafana 데이터 저장소
  loki-data:          # Loki 로그 데이터 저장소

# 네트워크 설정
networks:
  local_net:
    name: local_net
4. docker compose 실행
cd ~/grafana
docker compose up --build
5. 접속 확인
http://localhost:4000에 접속하여 그라파나에 정상적으로 접속이 가능한지 확인한다.

grafana 대시보드 설정
이제 거의 완료했다.
대시보드는 사용하는 사람이 편한 대로 설정하면 된다.
밑의 과정은 내 프로젝트에 적용한 예시이다.
1. 대시보드 로그인
초기 유저명/비밀번호는 admin/admin이다.
2. 데이터 소스 추가

로그인 후 보이는 첫 화면이다.
왼쪽 사이드바의 Connections -> data sources 탭으로 들어간다.

Add data source 버튼을 클릭한다.

Prometheus와 Loki data source를 각각 추가해야 한다.
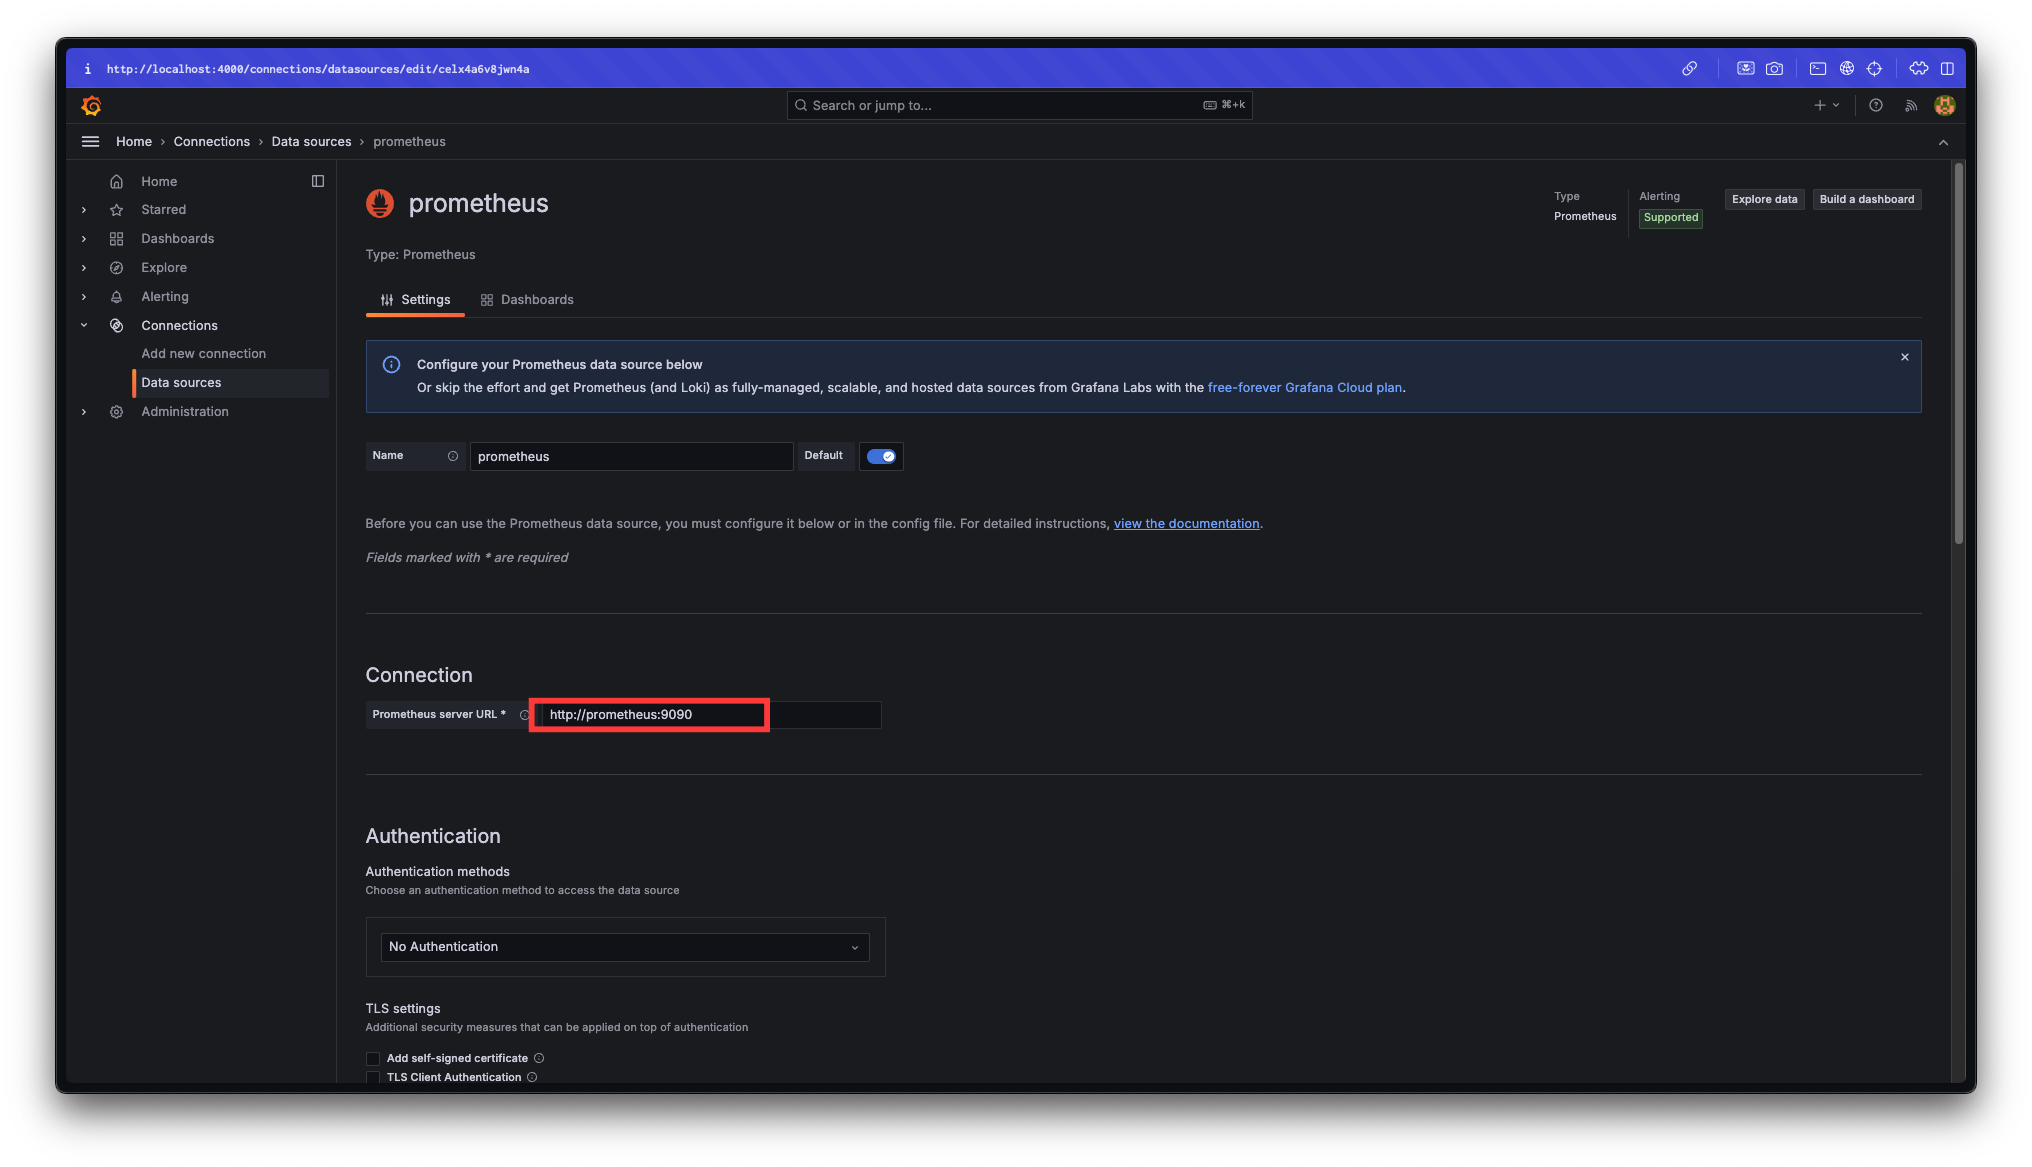
Connection의 server URL을 http://prometheus:9090으로 지정해 주고 저장한다.

Connection의 server URL을 http://Loki:3100으로 지정해주고 저장한다.

각 데이터 소스가 추가된 것을 확인할 수 있다.
각 데이터 소스 페이지에 접속하면 url 끝에 uid가 나오는데 이를 복사해두어야 한다.


prometheus와 loki의 데이터 소스 추가가 완료되었다.
3. 대시보드 추가

왼쪽 사이드바의 Dashboards 탭으로 들어가 Create dashboard 버튼을 클릭한다.

import dashboard 버튼을 클릭한다.
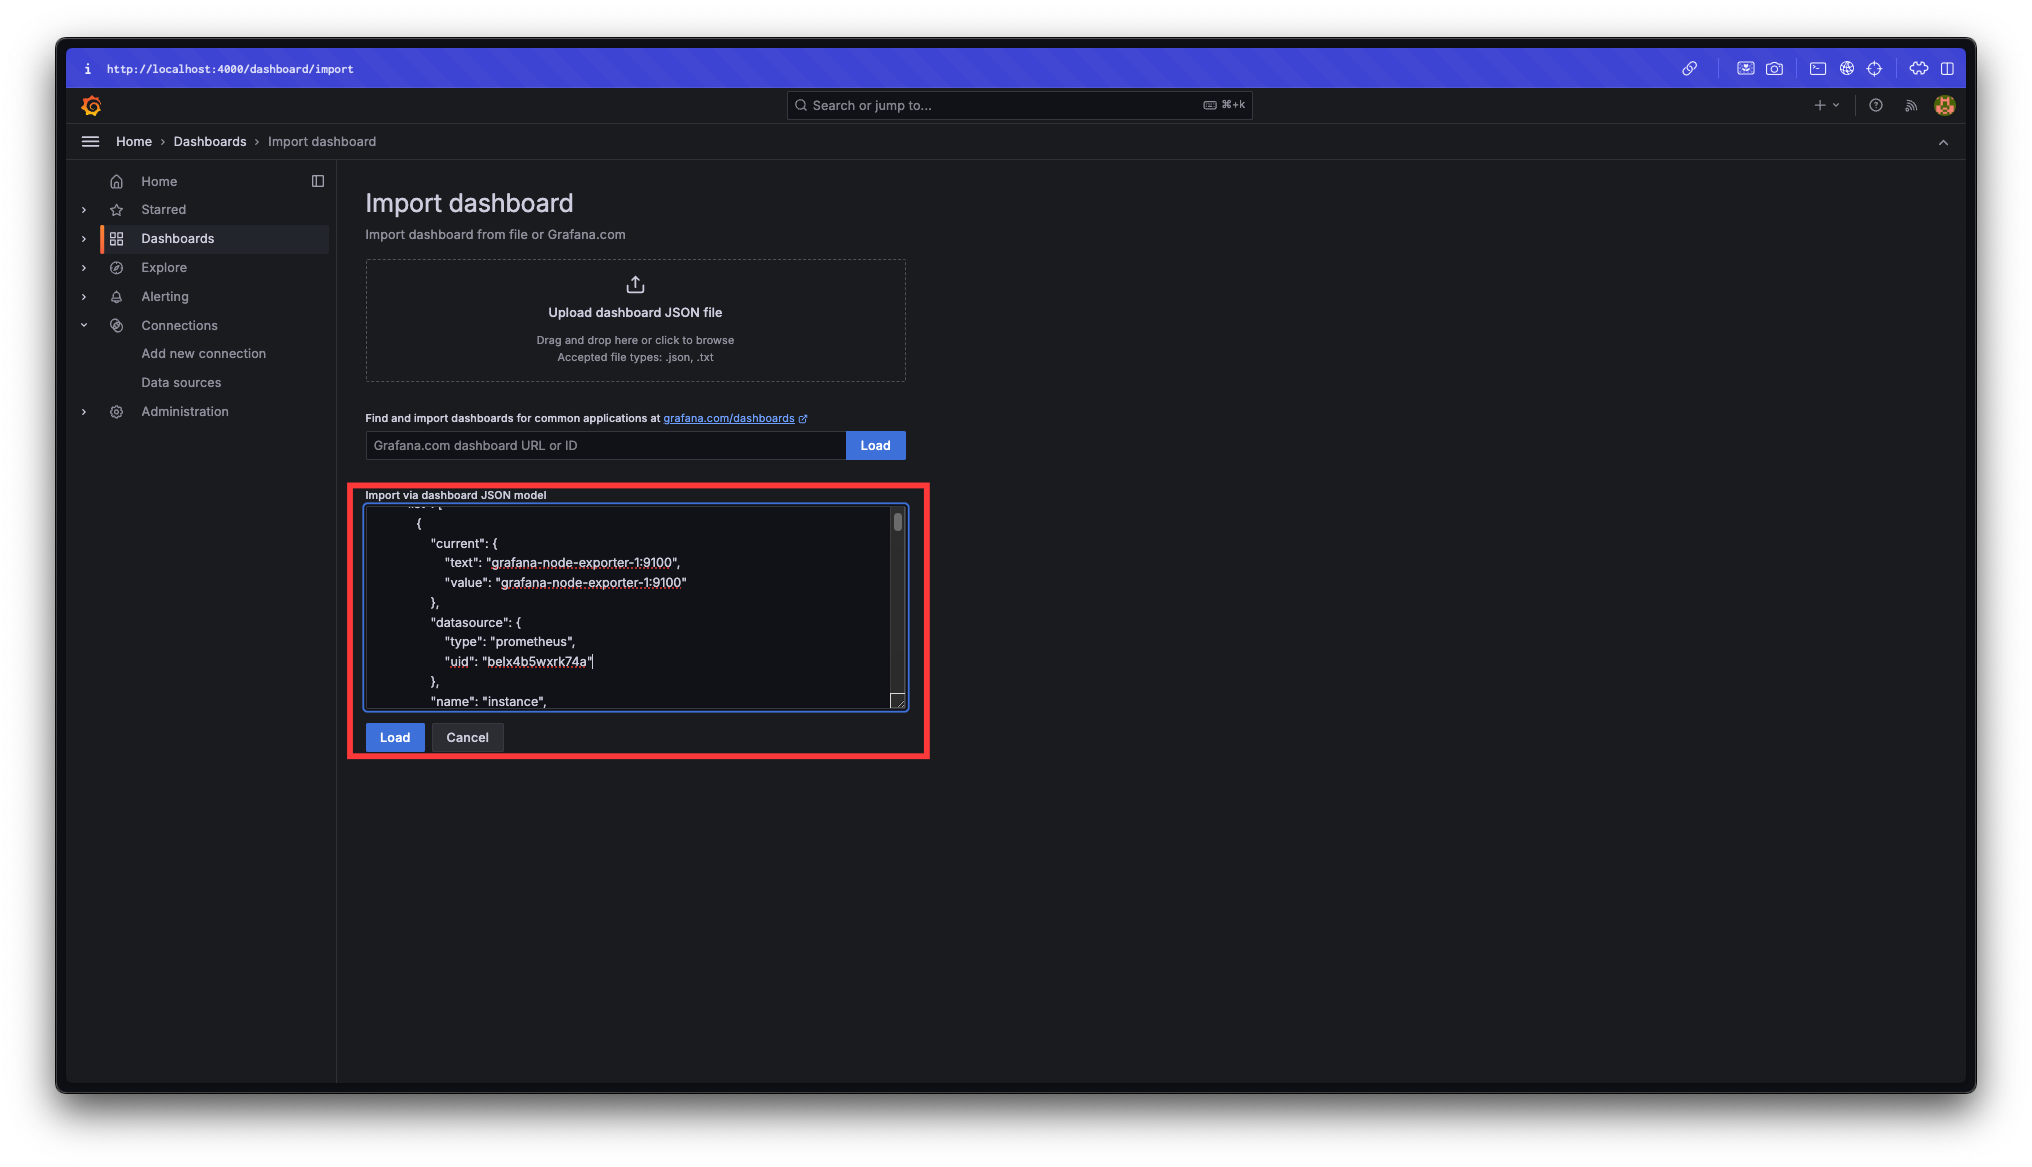
아래 코드는 grafana에서 지원하는 dashboard json model이다.
아래 내용 중 datasource uid를 자신의 uid로 수정하여 Import via dashboard JSON model 입력창에 입력한다.
{
"time": {
"from": "now-1h",
"to": "now"
},
"timezone": "browser",
"title": "PHP Server Monitoring",
"version": 1,
"refresh": "5s",
"schemaVersion": 39,
"tags": [
"php",
"apache",
"monitoring"
],
"templating": {
"list": [
{
"current": {
"text": "grafana-node-exporter-1:9100",
"value": "grafana-node-exporter-1:9100"
},
"datasource": {
"type": "prometheus",
"uid": "change me"
},
"name": "instance",
"query": "label_values(node_cpu_seconds_total, instance)",
"refresh": 1,
"type": "query"
}
]
},
"panels": [
{
"datasource": {
"type": "prometheus",
"uid": "change me"
},
"fieldConfig": {
"defaults": {
"decimals": 1,
"mappings": [
{
"options": {
"match": "null",
"result": {
"text": "N/A"
}
},
"type": "special"
}
],
"thresholds": {
"mode": "absolute",
"steps": [
{
"color": "green",
"value": null
},
{
"color": "red",
"value": 80
}
]
},
"unit": "s"
}
},
"gridPos": {
"h": 4,
"w": 4,
"x": 0,
"y": 0
},
"options": {
"colorMode": "none",
"graphMode": "none",
"reduceOptions": {
"calcs": [
"mean"
]
},
"textMode": "auto"
},
"targets": [
{
"datasource": {
"type": "prometheus",
"uid": "change me"
},
"expr": "apache_uptime_seconds_total",
"format": "time_series",
"refId": "A"
}
],
"title": "Uptime",
"type": "stat"
},
{
"datasource": {
"type": "prometheus",
"uid": "change me"
},
"fieldConfig": {
"defaults": {
"color": {
"mode": "palette-classic"
},
"custom": {
"drawStyle": "line",
"fillOpacity": 100,
"lineWidth": 3,
"showPoints": "never"
},
"thresholds": {
"mode": "absolute",
"steps": [
{
"color": "green",
"value": null
},
{
"color": "red",
"value": 80
}
]
},
"unit": "short"
},
"overrides": [
{
"matcher": {
"id": "byName",
"options": "Apache Down"
},
"properties": [
{
"id": "color",
"value": {
"fixedColor": "#BF1B00",
"mode": "fixed"
}
},
{
"id": "custom.transform",
"value": "negative-Y"
}
]
}
]
},
"gridPos": {
"h": 4,
"w": 20,
"x": 4,
"y": 0
},
"options": {
"legend": {
"calcs": [
"mean",
"lastNotNull",
"max",
"min"
],
"displayMode": "table",
"placement": "right",
"showLegend": true
}
},
"targets": [
{
"datasource": {
"type": "prometheus",
"uid": "change me"
},
"expr": "count(apache_up == 1)",
"legendFormat": "Apache Up",
"refId": "A"
},
{
"datasource": {
"type": "prometheus",
"uid": "change me"
},
"expr": "scalar(count(apache_up == 0))",
"legendFormat": "Apache Down",
"refId": "B"
}
],
"title": "Apache Up / Down",
"type": "timeseries"
},
{
"datasource": {
"type": "prometheus",
"uid": "change me"
},
"fieldConfig": {
"defaults": {
"color": {
"mode": "palette-classic"
},
"custom": {
"drawStyle": "line",
"fillOpacity": 10,
"lineWidth": 1,
"showPoints": "never"
},
"thresholds": {
"mode": "absolute",
"steps": [
{
"color": "green",
"value": null
},
{
"color": "red",
"value": 80
}
]
},
"unit": "short"
}
},
"gridPos": {
"h": 10,
"w": 12,
"x": 0,
"y": 4
},
"interval": "15s",
"options": {
"legend": {
"calcs": [
"mean",
"lastNotNull",
"max",
"min"
],
"displayMode": "table",
"placement": "bottom",
"showLegend": true
},
"tooltip": {
"mode": "multi"
}
},
"targets": [
{
"datasource": {
"type": "prometheus",
"uid": "change me"
},
"expr": "rate(apache_accesses_total[1m])",
"legendFormat": "Accesses",
"refId": "A"
}
],
"title": "초당 평균 요청량",
"type": "timeseries"
},
{
"datasource": {
"type": "prometheus",
"uid": "change me"
},
"fieldConfig": {
"defaults": {
"color": {
"mode": "palette-classic"
},
"custom": {
"drawStyle": "line",
"fillOpacity": 10,
"lineWidth": 1,
"showPoints": "never"
},
"thresholds": {
"mode": "absolute",
"steps": [
{
"color": "green",
"value": null
},
{
"color": "red",
"value": 80
}
]
},
"unit": "deckbytes"
}
},
"gridPos": {
"h": 10,
"w": 12,
"x": 12,
"y": 4
},
"options": {
"legend": {
"calcs": [
"mean",
"lastNotNull",
"max",
"min"
],
"displayMode": "table",
"placement": "bottom",
"showLegend": true
},
"tooltip": {
"mode": "multi"
}
},
"targets": [
{
"datasource": {
"type": "prometheus",
"uid": "change me"
},
"expr": "rate(apache_sent_kilobytes_total[1m])",
"legendFormat": "Kilobytes Sent",
"refId": "A"
}
],
"title": "초당 평균 전송량",
"type": "timeseries"
},
{
"datasource": {
"type": "prometheus",
"uid": "change me"
},
"fieldConfig": {
"defaults": {
"color": {
"mode": "palette-classic"
},
"custom": {
"drawStyle": "line",
"fillOpacity": 10,
"lineWidth": 1,
"showPoints": "auto"
},
"max": 100,
"min": 0,
"thresholds": {
"mode": "absolute",
"steps": [
{
"color": "green",
"value": null
},
{
"color": "red",
"value": 80
}
]
},
"unit": "percent"
}
},
"gridPos": {
"h": 8,
"w": 12,
"x": 0,
"y": 14
},
"options": {
"legend": {
"displayMode": "list",
"placement": "bottom",
"showLegend": true
},
"tooltip": {
"mode": "single"
}
},
"targets": [
{
"datasource": {
"type": "prometheus",
"uid": "change me"
},
"expr": "100 - (avg by(instance) (rate(node_cpu_seconds_total{mode=\"idle\",instance=\"$instance\"}[1m])) * 100)",
"legendFormat": "{{instance}}",
"refId": "A"
}
],
"title": "CPU 사용량",
"type": "timeseries"
},
{
"datasource": {
"type": "prometheus",
"uid": "change me"
},
"fieldConfig": {
"defaults": {
"color": {
"mode": "thresholds"
},
"max": 100,
"min": 0,
"thresholds": {
"mode": "absolute",
"steps": [
{
"color": "green",
"value": null
},
{
"color": "yellow",
"value": 70
},
{
"color": "red",
"value": 90
}
]
},
"unit": "percent"
}
},
"gridPos": {
"h": 8,
"w": 12,
"x": 12,
"y": 14
},
"options": {
"reduceOptions": {
"calcs": [
"lastNotNull"
]
},
"showThresholdMarkers": true
},
"targets": [
{
"datasource": {
"type": "prometheus",
"uid": "change me"
},
"expr": "(node_memory_MemTotal_bytes{instance=\"$instance\"} - node_memory_MemAvailable_bytes{instance=\"$instance\"}) / node_memory_MemTotal_bytes{instance=\"$instance\"} * 100",
"legendFormat": "Used Memory",
"refId": "A"
}
],
"title": "Memory 사용량",
"type": "gauge"
},
{
"datasource": {
"type": "loki",
"uid": "change me"
},
"gridPos": {
"h": 8,
"w": 24,
"x": 0,
"y": 30
},
"options": {
"dedupStrategy": "none",
"enableLogDetails": true,
"showTime": true,
"sortOrder": "Descending",
"wrapLogMessage": true
},
"targets": [
{
"expr": "{job=\"php-access\"}",
"refId": "A"
}
],
"title": "Access Logs",
"type": "logs"
},
{
"datasource": {
"type": "loki",
"uid": "change me"
},
"gridPos": {
"h": 8,
"w": 24,
"x": 0,
"y": 38
},
"options": {
"dedupStrategy": "exact",
"enableLogDetails": true,
"showTime": true,
"sortOrder": "Descending",
"wrapLogMessage": true
},
"targets": [
{
"expr": "{job=\"php-info\"}",
"refId": "A"
}
],
"title": "Info Logs",
"type": "logs"
}
]
}예시
"datasource": {
    "type": "prometheus",
    "uid": "change me"
},

->

"datasource": {
    "type": "prometheus",
    "uid": "belx4b5wxrk74a"
},
대시보드의 이름을 지정해주고 Import 버튼을 클릭하여 저장한다.

대시보드 이름을 클릭하여 대시보드 페이지로 이동한다.
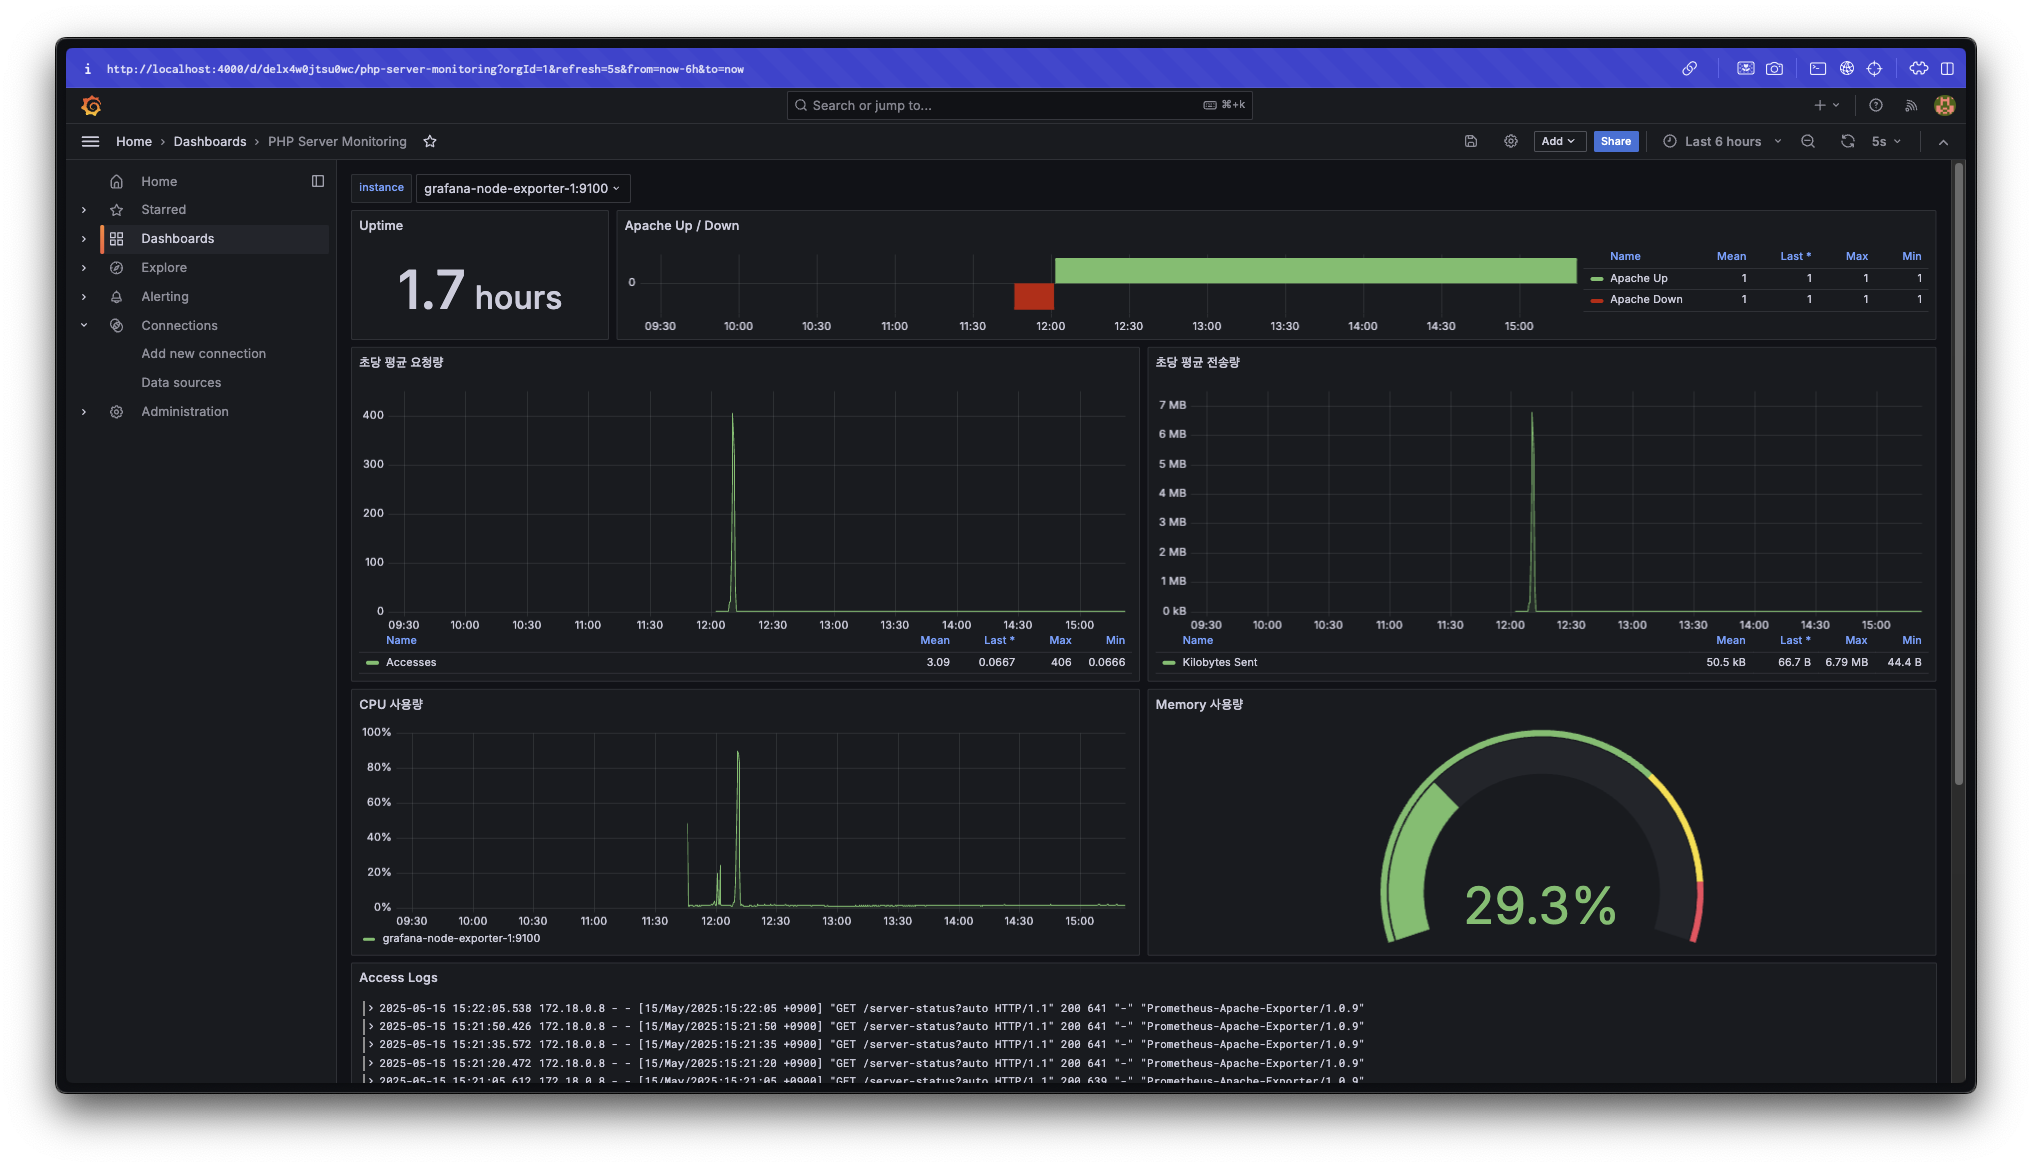

dashboard가 잘 추가된 것을 확인할 수 있다.
각 패널의 내용이 어떤 내용인지는 패널 제목으로 쉽게 유추가 가능하다.
Ex. 초당 평균 요청량 = 특정 시간의 15초(prometheus 설정에서 지정한 매트릭 수집 주기)동안 매 초 평균적으로 발생한 request 횟수
각 패널이 데이터를 가져오는 곳
- Uptime, Apache Up / Down, 초당 평균 요청량, 초당 평균 전송량 : Apache Exporter(prometheus)
- CPU 사용량, Memory 사용량 : Node Exporter(prometheus)
- Access Logs, Info Logs : ~/php/logs 경로에서 가져오는 apache log 파일 내용(Loki)
4. 테스트
apache 서버로 10,000번 정도 리퀘스트를 날려보면 위 이미지처럼 서버에 발생한 부하를 확인할 수 있다.
ab -n 10000 -c 100 http://apache-server/

# Ex. ab -n 10000 -c 100 http://localhost/
후기
다른 사람의 글을 여기저기 참고하고 ai의 도움도 많이 받았지만 결국 새로운 시스템에 대한 이해는 내 머릿속에서 혼자 해야 하고 이것저것 뒤져보려 하는 탐구심이 있어야 공부가 되는 것 같다. 이 모니터링 시스템에 대해 이해하기까지 너무 오랜 시간이 걸렸지만 불필요한 시간은 한순간도 없었던 것 같다.
또, 모니터링 시스템 구축뿐만 아니라 이것저것 하다 보니 처음 모니터링 시스템을 추가하려 한 때부터 이 글을 작성하기까지 너무 많은 시간이 흘렀다. 결과적으로 지식은 다양하게 늘었지만 한 가지 작업을 시작하기로 마음먹었으면 꾸준히 밀고 나가 완료시키는 끈기를 더욱 길러야 할 것 같다.
반응형
Contents
소중한 공감 감사합니다